Co-Founder & CTO

We are releasing a new biomass model. Not an incremental update. A ground-up rebuild of the architecture, the training data, and every preprocessing pipeline, designed to serve both carbon project MRV and corporate supply chain reporting with the same rigor.
Accurate biomass measurement underpins nearly everything we do at Kanop, from feasibility assessments and dynamic baselining for carbon projects to farm-level removals monitoring across commodity supply chains. Every improvement in accuracy, speed, or transparency compounds across every project and every client.
Today we are releasing our new biomass model. This is not an incremental update. It is a fundamental redesign of the architecture, the training data, and the preprocessing pipelines. The result is the most accurate, scalable, and transparent biomass data product we have ever produced.
The headline numbers: Mean Absolute Error reduced by 23% relative to the previous model version, and processing speed increased by 11X. But the improvements go well beyond a single metric.
Accuracy at the extremes. Low-AGB environments (grasslands, young plantations, early-stage ARR projects) and very high-AGB environments (dense tropical forests) have long been frontier challenges for satellite-based biomass estimation. Our new model delivers materially better performance in both regimes. For carbon projects, this means more reliable baseline estimates and more credible change detection at the stages that matter most: early growth and mature forest.
Sharper spatial detail. The model is available at two resolutions. The 30m product is live now, well suited for screening, due diligence, feasibility studies, and dynamic baseline establishment under methodologies like VM0047. The 10m product will follow late April, providing the spatial granularity needed for project-level MRV, plot-scale stocking index measurement, and farm-level biomass monitoring for supply chain reporting under the GHG Protocol Land Sector and Removals Standard.
Stronger temporal consistency. Year-over-year change detection has improved significantly. A new temporal stabilization procedure suppresses inter-annual noise from residual cloud contamination and phenological inconsistency in stable high-biomass forest, while preserving genuine disturbance signals. A biomass-dependent gate ensures that smoothing is only applied where it is physically appropriate: fully active in mature stands where spectral variability is artifactual, and effectively inactive in early-successional areas where inter-annual variability reflects genuine structural change.
Full uncertainty framework. For the first time, every estimate comes with a rigorous, end-to-end confidence interval. The model captures both aleatoric uncertainty (inherent sensor noise, atmospheric residuals, sub-pixel mixing) and epistemic uncertainty (model uncertainty arising from limited training data coverage and sensitivity to out-of-distribution inputs) through a combination of heteroscedastic prediction and Test Time Augmentation. Critically, when aggregating to polygon level, pixel-level uncertainties are not naively averaged. Instead, spatial correlation is estimated from the TTA ensemble, ensuring that polygon-level confidence intervals correctly reflect the effective number of independent observations rather than treating every pixel as independent.
The performance gains come from a redesign at every level of the pipeline.
Training data. The model is trained on 125 million hectares of LiDAR reference data: 42 million hectares from 754 airborne LiDAR campaigns across 10 countries, and 83 million hectares from the GEDI spaceborne LiDAR mission spanning 354 areas across 76 countries. We doubled the training surface relative to the previous generation. This global coverage ensures the model performs reliably across tropical, temperate, and boreal biomes.
Satellite input processing. Every preprocessing pipeline was rebuilt. Optical imagery (Landsat-8/9, Sentinel-2) now undergoes BRDF correction (only Landsat), improved cloud masking, and phenological month selection using MODIS NDVI composites to constrain acquisition windows to the active growing season. SAR processing (Sentinel-1, PALSAR-2) was overhauled with dual-season compositing for Sentinel-1 and calibrated dual-pol processing for PALSAR, extracting more structural signal from each sensor.
Architecture. The model adopts a multi-encoder, single-decoder design. Each input modality (optical, SAR, DEM) is processed by a dedicated convolutional encoder. Encoder outputs are aligned to a common resolution and merged through a multi-scale fusion module. The decoder generates predictions with physics-informed output heads: an architectural constraint ensures canopy height is always lower than tree height, and AGB is predicted jointly with heights and canopy cover through a shared feature representation.
For the 10m product, the architecture extends hierarchically. The 30m processing path runs first, producing fused latent features that are upsampled and concatenated with dedicated Sentinel-1 and Sentinel-2 encoders at 10m resolution. Raw Sentinel-2 spectral data is injected as skip connections at multiple scales to preserve spatial sharpness. The same physics-informed output heads and uncertainty quantification apply.
Post-calibration with field data. When project developers or corporates have field measurements available, an optional recalibration step fuses the deep learning estimate with a Gaussian Process Regression model interpolated from field plots. The two estimators are combined via inverse-variance weighting: near field plots, the GPR dominates and anchors the estimate to measured values; far from plots, the weight reverts to the deep learning model. This approach uses Google AlphaEarth Foundations satellite embeddings as exogenous features, providing a compact 64-dimensional representation of surface conditions that improves generalization across heterogeneous landscapes. The fused estimate has lower uncertainty than either estimator alone wherever the two are consistent.
We validated the model against 16 publicly available LiDAR-derived AGB reference datasets from peer-reviewed publications, covering tropical and temperate forests across multiple continents. After filtering for temporal alignment and appropriate site scale, 6 publications covering 113 sites and over 1,000,000 hectares of LiDAR-derived AGB maps were retained.
At the site level (the scale most relevant to carbon accounting), the model achieves an RMSE of 41.7 t DM/ha (rRMSE = 27%) with an R² of 0.73 across 110 sites. At the pixel level (30m), where within-site spatial variability is fully captured, the global weighted RMSE is 94.9 t DM/ha. The difference between these two numbers is expected: fine-scale errors from canopy gaps, mixed pixels, and terrain effects cancel when averaging over a site.
The validation methodology, reference datasets, and site-level results are documented in full in our [published methodology](link to methodology doc).
Both the 30m and 10m products share the same underlying architecture, training data, uncertainty quantification, and post-calibration capabilities.
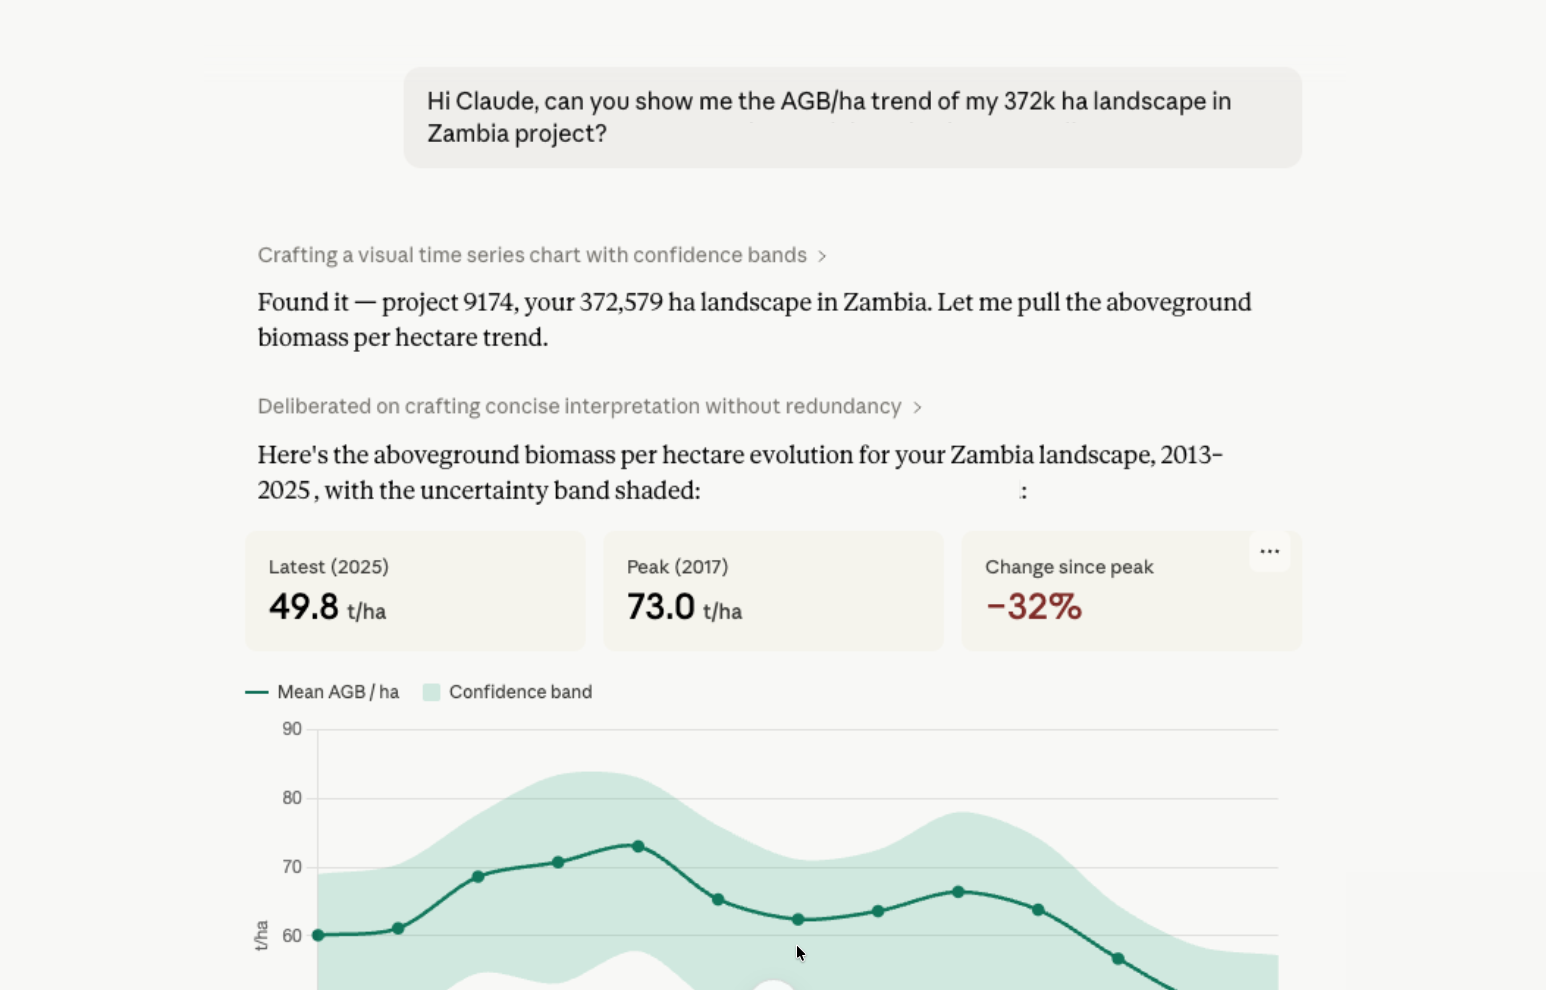
The 30m product (available now, annual data from 2013 to 2025) is built on Landsat and PALSAR imagery. It is designed for screening, due diligence, feasibility studies, dynamic baseline establishment, and matching protocol development under VM0047 and comparable methodologies.
The 10m product (coming April 2026, annual data from 2017 to 2025) incorporates Sentinel-1 and Sentinel-2, providing the spatial detail needed for project-level MRV, plot-scale monitoring, and farm-level biomass assessment for supply chain reporting.
Both products will benefit from the integration of next-generation SAR missions (NISAR and ESA's Biomass satellite) in H2 2026.
This release serves two distinct audiences that increasingly overlap.
Carbon project developers, investors, and standards bodies need accurate, transparent, auditable biomass data for feasibility assessments, dynamic baselining, stocking index measurement, performance benchmark derivation, and ongoing MRV. The new model's accuracy gains, full uncertainty quantification, and improved temporal consistency directly support these workflows under VM0047 (stocking index), Isometric's Biosphere Protocols, Equitable Earth, Gold Standard, and others.
Corporates with nature-intensive supply chains face growing requirements to account for land sector emissions and removals under the GHG Protocol Land Sector and Removals Standard (effective January 2027), SBTi FLAG targets, and TNFD disclosures. The 10m product, in particular, provides the farm-level granularity needed to measure agroforestry removals, track carbon stock changes at individual sourcing sites, and build the ongoing monitoring systems these frameworks require.
The 10m product launches in April. We are also preparing a series of application-specific deep dives covering dynamic baselining with the new model under VM0047, supply chain removals measurement for LSRS compliance, and a detailed walkthrough of the post-calibration workflow.
The full methodology document is available below. If you want to explore what the new model means for your projects or supply chain, get in touch at hello@kanop.io.