How do you help with Scope 3 FLAG emissions measurement?
Most companies in land-intensive sectors (food, agriculture, forestry) are required by SBTi to set FLAG targets covering land use change emissions and carbon removals. The challenge is that FLAG accounting demands farm-level, geographically precise data across complex supply chains, and the new GHG Protocol LSRS (effective January 2027) raises the bar further with explicit traceability and spatial boundary requirements.
Kanop solves this by combining satellite imagery and AI to measure land use change, biomass carbon stocks, and removals at the plot level across your sourcing regions. This means you can move beyond global emission factor averages and report with primary, site-specific data tied to actual land management practices.
We already do this at scale. For Mars, we measure agroforestry carbon removals across cocoa farms in West Africa, aligned with both the GHG Protocol Land Sector and Removals framework and SBTi FLAG pathways. The same approach applies to any agricultural commodity: palm oil, soy, coffee, rubber, or timber supply chains.
Can I prove the impact of my sustainability programs?
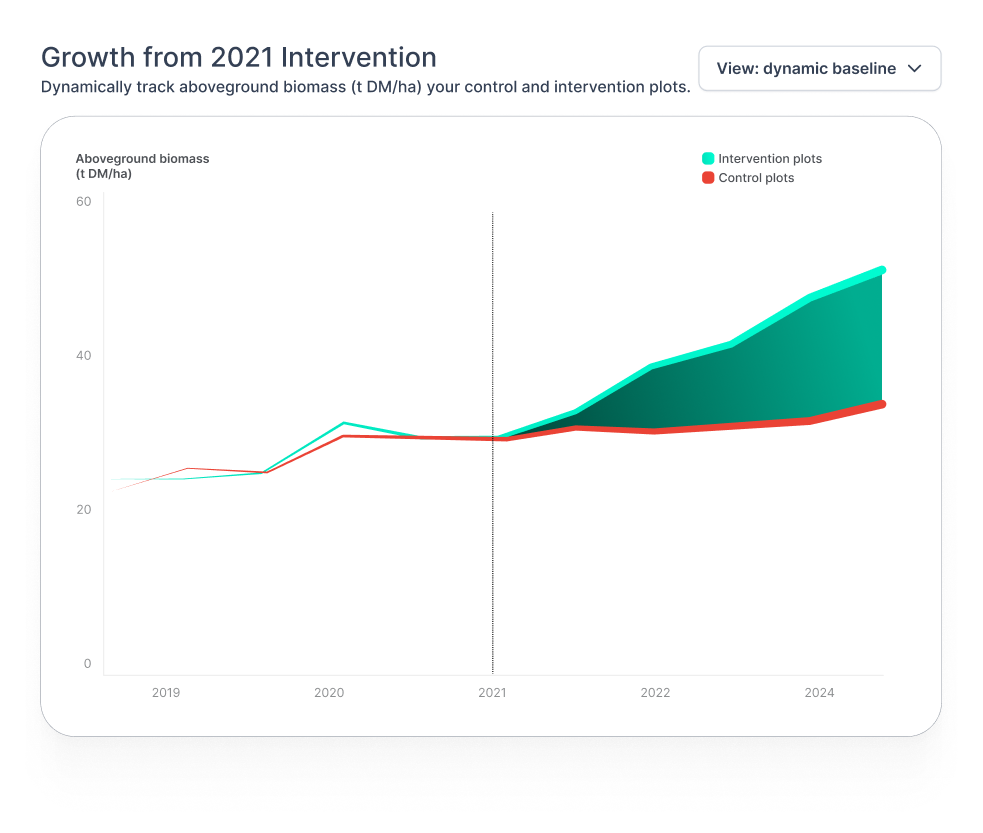
Yes. Kanop establishes dynamic baselines using historical satellite data, then continuously monitors changes in carbon stocks, tree cover, and land use at the site level. This means you can isolate the actual carbon gains from your interventions (not just what was already there), quantify avoided deforestation against a credible counterfactual, and track biodiversity indicators over time.
Whether you are running agroforestry programs, reforestation projects, or zero-deforestation commitments across your supply chain, you get audit-ready, third-party verifiable evidence to demonstrate ROI to your board, investors, and external stakeholders.
Which environmental reporting frameworks does Kanop support?
Kanop provides the site-level geospatial data that underpins compliance across the most demanding nature and climate frameworks: TNFD using the LEAP approach for nature-related risk assessment, CSRD/ESRS E4 for biodiversity and ecosystem disclosures, GHG Protocol LSRS (Land Sector and Removals Standard, effective January 2027) for land emissions and carbon removal accounting, SBTN for science-based nature targets, CDP and GRI for environmental disclosures, and EUDR (EU Deforestation Regulation, enforceable December 2026) for plot-level deforestation-free verification.
What makes Kanop different: these frameworks increasingly require precise, location-specific evidence, not estimates. Our satellite and AI stack delivers asset-level monitoring data that feeds directly into due diligence statements, materiality assessments, and audit-ready documentation across multiple frameworks simultaneously.
What are the different data products available?
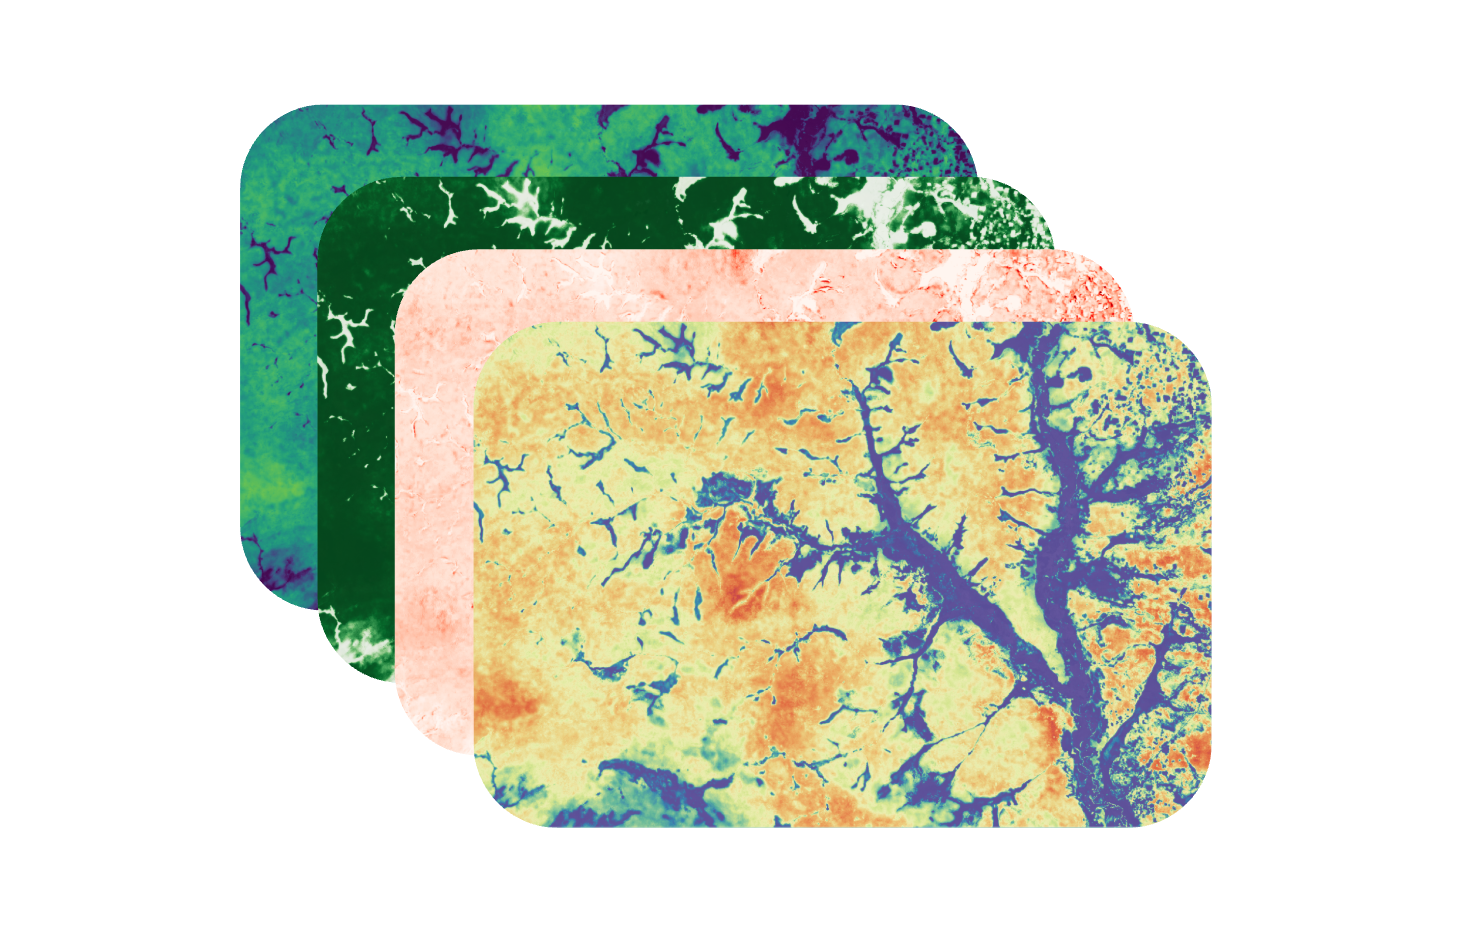
Kanop delivers site-level nature intelligence across three core data layers:
Land Use & Land Use Change to map and monitor deforestation, forest degradation, and land conversion across your sourcing regions, with historical baselines going back over a decade.
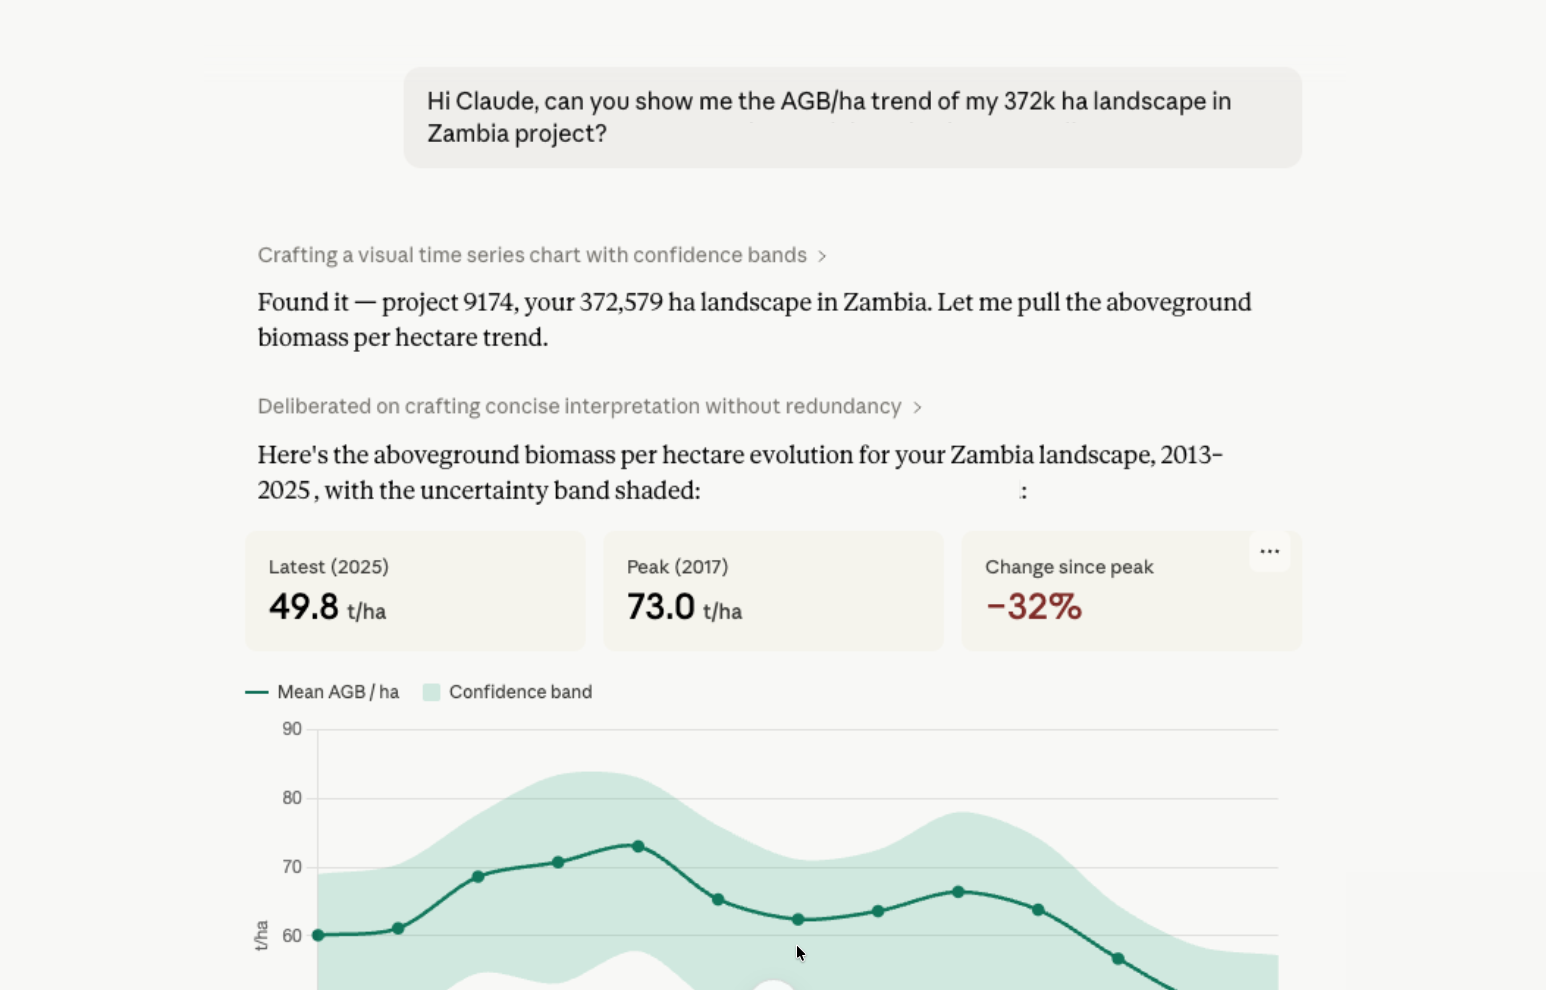
Carbon Stocks & Removals to quantify above and belowground biomass, carbon stock changes, and removal rates at the plot level, with field-calibrated models and uncertainty quantification at 95% confidence intervals.
Canopy & Vegetation Metrics including canopy cover, canopy height, and forest cover at 10 to 30-meter resolution, enabling precise tracking of agroforestry systems, restoration progress, and supply chain environmental performance.
All data products are delivered with audit-ready documentation and are designed to feed directly into EUDR due diligence statements, GHG Protocol LSRS inventories, SBTi FLAG target tracking, and TNFD/CSRD disclosures. Whether you are monitoring cocoa farms in West Africa or soy sourcing in South America, you get the granular, verifiable evidence your compliance, sustainability, and procurement teams need.
Can your solution differentiate between primary forests and planted forests?
Yes, our platform harnesses satellite imagery and AI to discern various types of forests, be it primary forests or plantations.
How accurate is the estimation of the aboveground biomass?
Accuracy depends on the scale of analysis. In carbon accounting and MRV, the relevant metric is typically the average biomass over a project area or polygon, not individual pixel values.
At the site level (the scale most relevant to carbon accounting), our model achieves an RMSE of 41.7 t DM/ha (relative RMSE = 27%) and an R² of 0.73, validated across 110 independent sites covering over 1,000,000 hectares of LiDAR-derived reference data from peer-reviewed publications. This means the model reliably estimates the average carbon stock of a project area.
At the pixel level (30m resolution), the global weighted RMSE is 94.9 t DM/ha. This is roughly double the site-level figure, which is expected: fine-scale errors from canopy gaps, mixed pixels, and terrain effects partially cancel out when averaged over larger areas.
Every estimate includes a confidence interval (95% by default), propagated from pixel to polygon level and accounting for spatial correlation between pixels. When field measurements are available, an optional post-calibration step using Gaussian Process Regression can further reduce uncertainty at the local level.