





















How do you help with Scope 3 FLAG emissions measurement?
Companies in land-intensive sectors (food, agriculture, forestry) that set science-based targets must include FLAG targets covering land use change emissions and carbon removals. The challenge is that FLAG accounting demands farm-level, geographically precise data across complex supply chains, and the new GHG Protocol LSRS (effective January 2027) raises the bar further with explicit traceability and spatial boundary requirements.
Kanop solves this by combining satellite imagery and AI to measure land use change, biomass carbon stocks, and removals at the plot level across your sourcing regions. This means you can move beyond global emission factor averages and report with primary, site-specific data tied to actual land management practices.
We already do this at scale, measuring agroforestry carbon removals across thousands of cocoa farms in West Africa for a world-leading chocolate manufacturer, aligned with both the GHG Protocol Land Sector and Removals Standard and SBTi FLAG pathways. The same approach applies to any agricultural commodity: palm oil, soy, coffee, rubber, or timber supply chains.
How does Kanop help track land use changes in my sourcing regions?
Kanop monitors land use change across your sourcing regions every year, using satellite imagery and AI. We map deforestation, forest degradation and land conversion at plot level, with history back to 2000, so you can spot risks before they become reporting issues.
Each sourcing location gets its own baseline, so you can measure change over time, quantify land use change emissions for your GHG Protocol LSRS inventory, track SBTi FLAG and zero-deforestation commitments, and make sourcing decisions on accurate, up-to-date data.
What project type do you support?
Kanop serves two main audiences: nature-based carbon project stakeholders and corporates with nature-dependent supply chains.
On the carbon market side, we support the full lifecycle of forest and coastal ecosystem projects, from eligibility assessments and dynamic baselining through to biomass quantification and ongoing monitoring. This includes reforestation and afforestation (ARR), avoided deforestation (REDD+), improved forest management (IFM), and blue carbon projects such as mangrove restoration.
On the supply chain side, we help companies sourcing agricultural commodities (cocoa, coffee, palm oil, rubber, soy, and others) understand and report on the environmental impact of their sourcing landscapes. This includes quantifying land use change emissions, measuring carbon removals from intervention programs like agroforestry, monitoring deforestation risk, and assessing ecosystem condition, all aligned with leading corporate reporting frameworks for land use, nature, and climate.
Is Kanop compatible with Verra, Gold Standard and other VCM standards?
Yes. Kanop's platform supports all major carbon standards, including Verra, Gold Standard, Isometric, Equitable Earth, BioCarbon Standard, Cercarbono, Plan Vivo and others.
Verra. Kanop is a vetted Data Service Provider for VM0047 dynamic baselines, one of the first three providers vetted for performance benchmarks following Verra's independent assessment of our data product methodology and systems (announcement, May 2026). Our outputs feed directly into the Verra Project Hub, giving developers a methodology-aligned data layer that integrates with the submission and review process. We have delivered more than 30 VM0047 dynamic baselines to date, and also support VM0048/VMD0055 (REDD+), VM0033 (blue carbon) and VT0005.
Gold Standard. We maintain an ongoing feedback loop with Gold Standard on the STARR methodology and support their A/R methodology (v2.0) for eligibility, quantification and monitoring. Our remote sensing data products are also compatible with their mangrove methodology.
Isometric. Out of more than twenty applicants, Kanop was selected in Isometric's first cohort of nature-based service partners and was the only organisation chosen across both categories: feasibility assessment partner and Earth observation data provider (announcement, February 2026). Projects certifying under Isometric's Biosphere Protocols for reforestation, improved forest management, mangrove restoration and agroforestry can integrate Kanop's monitoring directly within the certification workflow, with Isometric procuring the data on behalf of suppliers.
Equitable Earth. Kanop ranked among the top performing providers in Equitable Earth's independent aboveground biomass benchmark, tested against terrestrial and aerial LiDAR reference data, and is one of two biomass providers underpinning their M001 methodology for terrestrial forest restoration. We support M001 with automated eligibility assessments and dynamic baseline simulations.
Beyond these, we work closely with BioCarbon Standard, Cercarbono, Plan Vivo, the American Carbon Registry, ART-TREES and Climate Action Reserve.
Can your solution differentiate between primary forests and planted forests?
Yes. This matters for your inventory: under the GHG Protocol LSRS, converting natural forest to plantation is a land use change emission. We combine land cover classification with time series of canopy height and cover to tell natural forest from plantations, and to date when a conversion happened.
Is ground data necessary?
No. Our models are designed to deliver verification-grade results without any field data, and they are validated independently: over 1,000,000 hectares of LiDAR-derived reference maps across 110 sites in temperate, tropical and mangrove ecosystems, with a mean absolute error of 32.8 t DM/ha (21% relative) and an R² of 0.65. Every prediction ships with a pixel-level confidence interval (95% by default).
That said, adding your field measurements is the most effective way to improve precision on a specific project. We recalibrate using Gaussian Process Regression, which learns correction patterns from both geographic proximity and spectral similarity, so outputs are anchored to measured values near your plots and spectrally similar pixels benefit from the same correction even when they sit far away. Lower uncertainty means smaller deductions at verification and fewer sample plots required in the first place.
What data sources do your data products use?
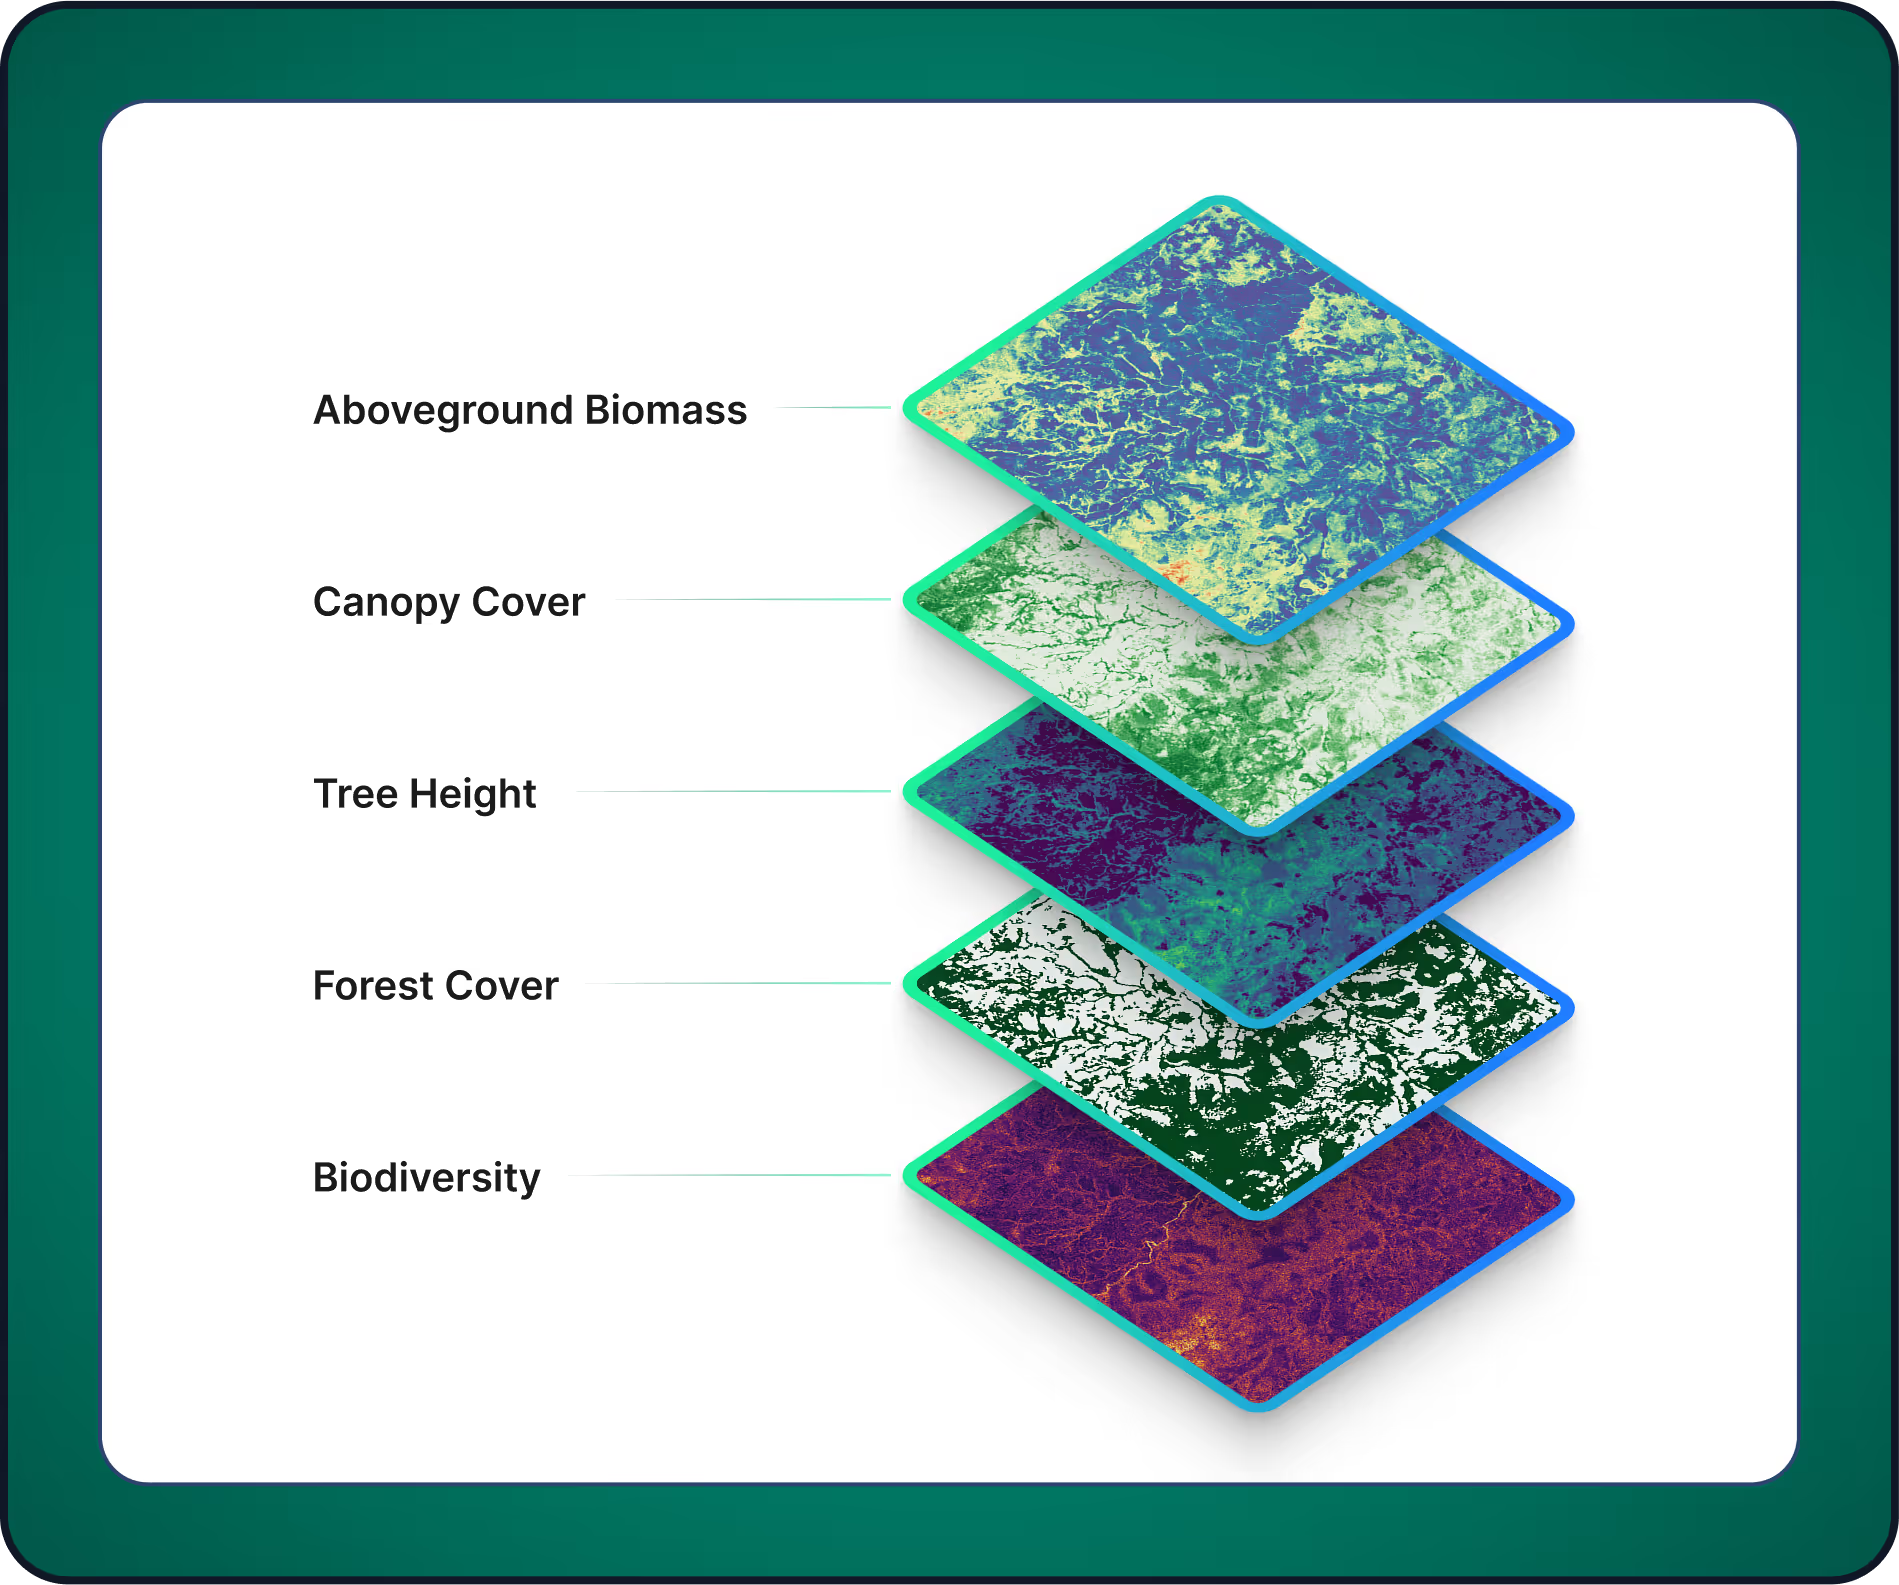
Kanop's models combine multiple satellite data sources to produce accurate biomass, canopy height, and forest cover estimates.
Optical imagery: Landsat 5, 7, 8 and 9 (30m resolution, from 2000) and Sentinel-2 (10-20m resolution, from 2015) provide spectral reflectance data linked to vegetation density and structure. MODIS NDVI composites are used to select the active growing season each year, so that seasonal effects are not mistaken for vegetation change.
SAR (Synthetic Aperture Radar): Sentinel-1 (C-band) and PALSAR-2 (L-band) capture structural information about vegetation regardless of cloud cover or lighting conditions, making them essential for consistent monitoring in tropical regions.
Elevation data: The SRTM digital elevation model provides topographic context (slope, aspect, elevation) that informs biomass predictions.
Training data: Our deep learning models are trained on 125 million hectares of LiDAR reference data, including 42 million hectares from 754 airborne LiDAR campaigns and 83 million hectares from NASA's GEDI spaceborne LiDAR mission, spanning 76 countries.
Field measurements (optional): When available, user-provided plot-level measurements can be used to recalibrate model outputs through a Gaussian Process Regression approach, improving local accuracy.
How accurate is the estimation of the aboveground biomass?
Accuracy depends on the scale of analysis. In carbon accounting and MRV, the relevant metric is typically the average biomass over a project area or polygon, not individual pixel values.
At the site level (the scale most relevant to carbon accounting), our model achieves a mean absolute error of 32.8 t DM/ha (21% relative error) and an R² of 0.65, validated across 110 independent sites covering over 1,000,000 hectares of LiDAR-derived reference data from peer-reviewed publications. This means the model reliably estimates the average carbon stock of a project area.
At the pixel level (30m resolution), errors are larger, as expected: fine-scale errors from canopy gaps, mixed pixels, and terrain effects partially cancel out when averaged over larger areas.
Every estimate includes a confidence interval (95% by default), propagated from pixel to polygon level and accounting for spatial correlation between pixels. When field measurements are available, an optional post-calibration step using Gaussian Process Regression can further reduce uncertainty at the local level.

