Co-Founder & CTO

Kanop is the first nature intelligence provider to connect its data products to AI assistants through MCP. Here is what that changes for the people who work with our data every day.
For most of the last decade, working with high-quality forest carbon data has meant working through a dashboard. You log in, you upload a boundary, you wait, you export, you reformat, and somewhere in a GIS tool you finally get to the question you actually wanted to answer: is this project growing, and by how much?
We have just removed almost all of those steps. Kanop's data products now connect directly to the AI assistant you already use, through a Model Context Protocol (MCP) server. As far as we can tell, we are the first nature intelligence provider to do this for forest carbon data products, and the change is more fundamental than it might first appear.
The Model Context Protocol is an open standard that lets AI assistants connect securely to external tools and data. Instead of building a one-off integration for every application, a provider exposes its capabilities once, and any compatible assistant can use them. Our MCP server makes Kanop's Monitoring 30m and Monitoring 10m biomass products available in exactly this way. It works with Claude, ChatGPT, and Mistral's Le Chat, with more clients supported as the ecosystem grows.
What this means in practice is that your project data stops living behind a login and starts living inside the conversation. You no longer go to the data. The data comes to wherever you are already thinking and writing.
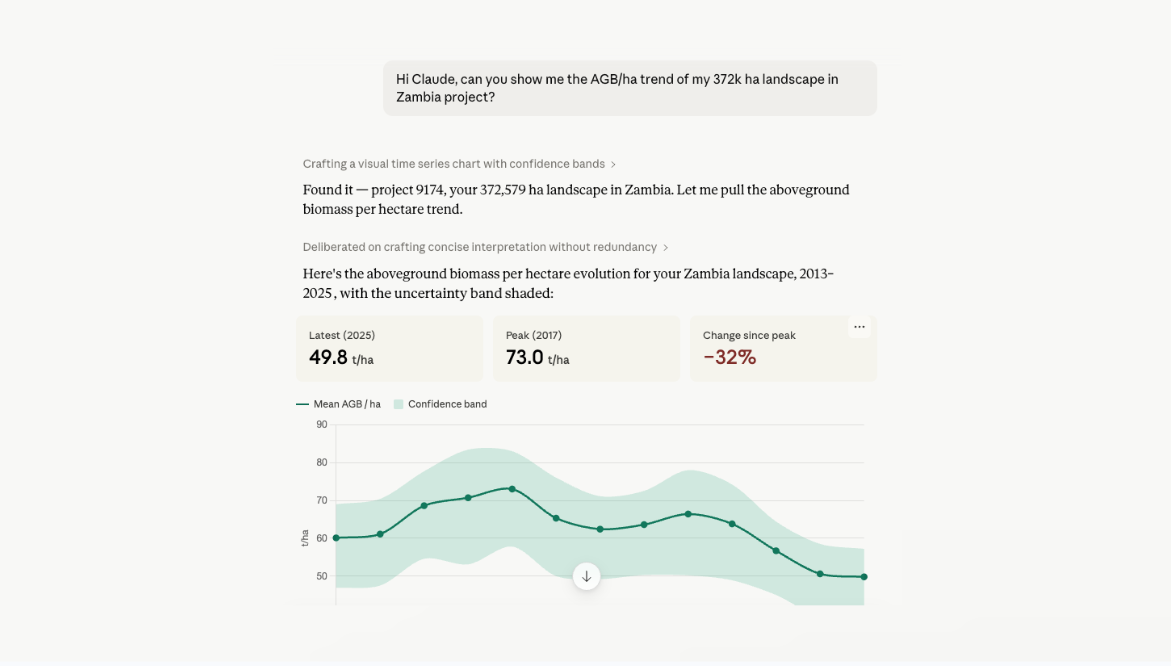
Picture a real workflow. You have a reforestation project: eight polygons in the Veracruz region of Mexico, saved as a GeoJSON file. You drop that file into your assistant and ask for the biomass time series.
From there, Kanop does the work. The assistant creates the project, triggers our biomass model, and returns an annual aboveground biomass (AGB) time series from 2013 onward, with 90% confidence intervals, reported both as totals and per hectare. For an ARR project, this is the moment of truth: you can see the textbook signature of a real restoration, a baseline decline followed by a clear inflection and a steady climb, with the uncertainty band tightening as the signal strengthens.
The conversation does not stop at a single chart. You can zoom into any individual polygon to understand which parcels are driving the trend, and which are lagging. You can overlay canopy cover, forest cover, and canopy height to see whether biomass gains are coming from genuine structural growth or from a denser canopy alone. And when you want the underlying data, you can pull the full set of GIS layers, biomass, belowground biomass, carbon stock, CO₂ equivalent, and a biodiversity index, as ready-to-use rasters.
The point that matters most is the last one. Because this all happens inside an assistant, you are not just retrieving numbers. You can ask why the curve dips in a given year, ask it to compare two metrics on a normalized scale, or ask what a particular pattern implies for your baseline. You get interpretation alongside the data, in plain language, without leaving the thread.
Understanding what the land is doing is the first question. The second is what it qualifies for, and the MCP server answers that one too.
You can run methodological eligibility analysis directly from the chat. Point the assistant at a site and assess it against the requirements of VM0047, the Isometric Reforestation Protocol, Equitable Earth, and more, the same kind of analysis our AI agents produce as full reports, now available as a live, conversational tool. The two capabilities reinforce each other. Read the biomass trajectory to see what the land is doing, then test what it qualifies for under the methodologies that matter to you, without switching tools or waiting on a report. For a developer scoping a new project, that is the feasibility question and the measurement question answered in one thread.
It would be easy to file this under "nice user experience improvement." It is more than that, for two reasons.
The first is access. The people who need forest carbon data are not all GIS specialists. Project developers, investors, and corporate sustainability teams often have sharp questions and no desire to learn a spatial analysis toolchain to answer them. Putting the data inside a conversational assistant collapses the distance between the question and the answer for everyone, not only the technical few.
The second is rigor, and this is where being a data provider matters rather than a generic tool. The numbers that come back through the MCP server are the same vetted outputs that sit behind our dynamic baselines and our MRV deliverables, built on a biomass model trained on more than 125 million hectares of LiDAR reference data. Conversational access does not mean approximate access. You are querying production-grade data, with its full uncertainty framework intact, propagated from pixel to polygon. The convenience is on the surface. The integrity goes all the way down.
Biomass measurement and eligibility are live today. The next capability we are building toward is the one developers and investors ask for most: audit-grade carbon projections, aligned to the key methodologies on the market, generated from the same conversation. Estimate the credits a project could realistically produce, against the specific quantification requirements of the standard it will be developed under, with the rigor a VVB and a buyer will expect. We are starting with ARR, where our dynamic baselining and biomass foundation are strongest, and expanding from there.
For now, the Kanop MCP server is available to our clients today. If you work on nature-based projects and want to see your own data answer your own questions in a single conversation, we would like to set you up. Reach out at hello@kanop.io.