Co-Founder & CEO

In April 2026, Verra approved the first credits ever issued under VM0047. The Brazil Cerrado 1 project received 230,120 VCUs, roughly two and a half years after the methodology was published. That single issuance settled a question the market had been circling since 2023: dynamic baselines work, and projects built on them can reach issuance.
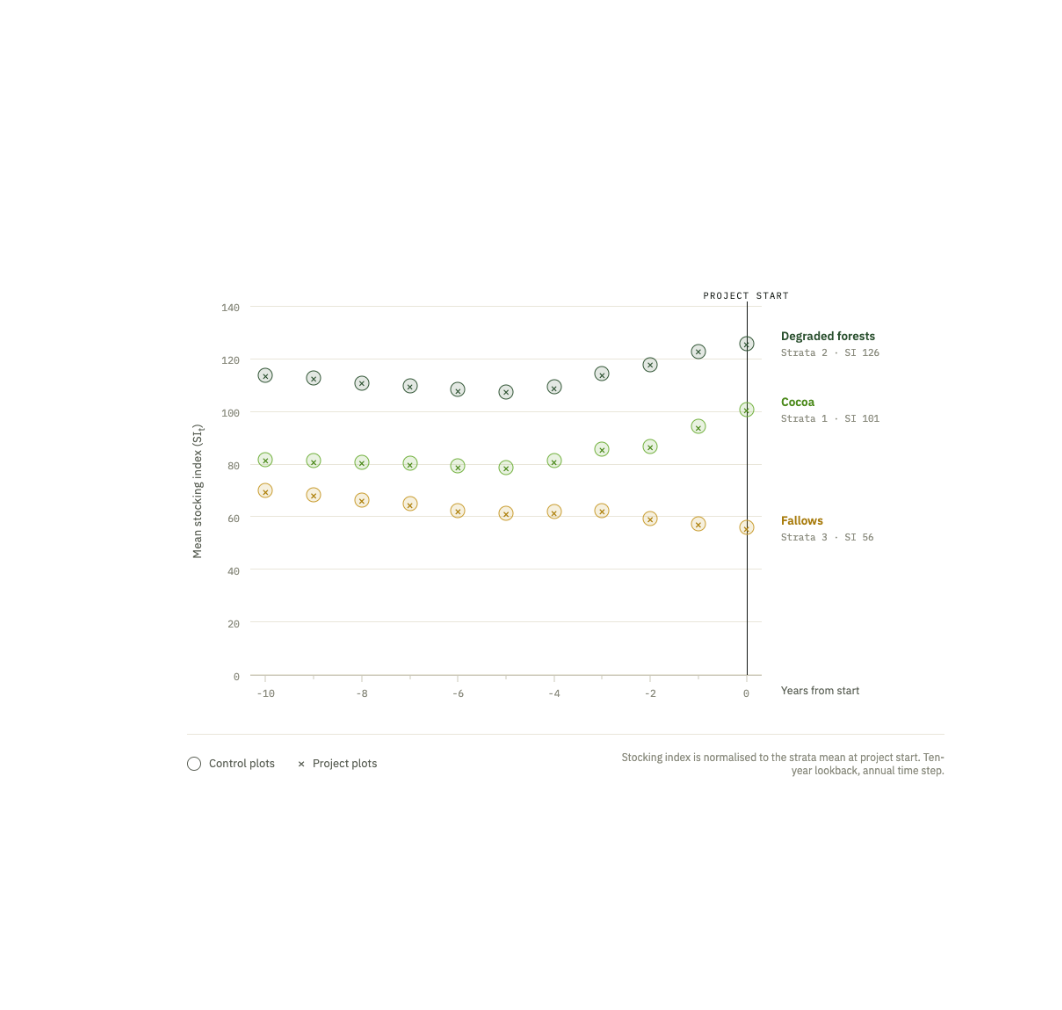
VM0047 replaced the static, projection-based baselines of the CDM era with a dynamic one. Rather than modelling what would have happened without the project, the methodology observes it. Control plots are selected from a surrounding donor pool, matched to project plots on their historical trajectory, and then monitored alongside the project for the duration of the crediting period. The difference between the two, expressed through the performance benchmark, becomes the deduction applied to the project's measured removals.
Conceptually this is a significant integrity improvement. Additionality stops being an argument and becomes a measurement. Practically, it introduces an analytical workload that no previous forest carbon methodology required, and it makes the underlying satellite data a direct determinant of credit volume rather than a supporting exhibit.
Three structural facts follow from that, and they shape everything else.
The first is that the stocking index is the whole engine. Every quantity in the baseline, and every performance benchmark for the life of the project, inherits the behaviour of the index chosen at the outset. VM0047 requires an index that correlates with carbon stocks, derives solely from remote sensing, and stays consistent over time. Those three requirements are easy to state and surprisingly hard to satisfy simultaneously.
The second is that history is not optional. The matching protocol needs an unbroken annual record reaching back years before the project start date. A data source that begins in 2017 cannot support a project that needs a decade of prior observation, and developers generally discover this after they have already built something.
The third is that evidence quality sets the verification timeline. A dynamic baseline is a chain of parameter decisions: donor pool extent, plot geometry, index selection, match acceptance thresholds, forecasting approach. Each is defensible, and each will be questioned. Projects that arrive at validation with those decisions documented and their sensitivity tested move through review. Projects that arrive with results but not reasoning do not.
For projects still transitioning, the clock also matters. Verra retired the ARR modules under the VM0007 framework, VMD0041, VMD0043 and VMD0045, and consolidated ARR activity under VM0047. Projects listed under VM0047 v1.0 need to complete registration by 31 December 2026. Version 1.1, active since May 2025, is the current text and extended applicability to degraded forest land alongside several other refinements.
VM0047 permits vegetation indices such as NDVI, EVI and NDFI as stocking indices, and many projects use them because they are free and familiar. We use our own aboveground biomass estimates instead, and this is the single most consequential difference between our approach and a conventional one.
The reasoning is physical. Vegetation indices measure greenness, which is a proxy for chlorophyll activity, not for biomass. The relationship between the two is neither linear nor stable, and it breaks down in three ways that matter for an ARR project.
Vegetation indices saturate. Once a canopy closes, additional biomass produces almost no additional signal. This has been documented in the remote sensing literature for two decades (Mutanga & Skidmore, 2004, International Journal of Remote Sensing, on narrow band indices overcoming the saturation problem), and more recent radiative transfer work has explained the mechanism in forest canopies specifically (Remote Sensing of Environment, 2023). For an ARR project, saturation arrives precisely when the project is accumulating carbon fastest.
They are also noisy in both directions. Greenness responds to atmospheric conditions, residual cloud, and phenology. Research on seasonal Landsat time series has shown that the correlation between NDVI and measured biomass varies materially depending on which part of the year the observation comes from (ISPRS Journal of Photogrammetry and Remote Sensing, 2019). In a dynamic baseline, that variance does not average out. It propagates into the slope comparison between project and control plots, and from there into the performance benchmark, year after year.
And they miss early growth. In the first few years after planting or the onset of natural regeneration, greenness in young vegetation is difficult to separate from ground cover and herbaceous response. Biomass is accumulating, but the index does not register it cleanly, which delays the point at which a project can demonstrate divergence from its controls.
Our aboveground biomass layer is built to avoid all three. The model estimates biomass directly in tonnes of dry matter per hectare, a quantity with a direct linear relationship to carbon stock and a defined conversion path. It draws on optical imagery (Landsat, Sentinel-2), radar (Sentinel-1, PALSAR-2) and elevation data through dedicated encoders, so it is not dependent on cloud-free optical observation. It was trained on 42 million hectares of airborne LiDAR from 754 campaigns and 83 million hectares of spaceborne LiDAR from NASA's GEDI mission, and it predicts tree height, canopy height, canopy cover and biomass jointly, which improves each individual output.
For temporal consistency, the requirement VM0047 states explicitly, we apply a LandTrendr-based stabilisation procedure across the annual series. This suppresses inter-annual noise from atmospheric variation and sensor drift while preserving genuine signals, so a fire or a harvest still registers as a step change rather than being smoothed away.
The commercial consequence is what matters to a developer. Because the index tracks biomass rather than greenness, growth is detected earlier and saturation arrives later. Because the series is stabilised, the performance benchmark behaves predictably from one verification to the next rather than fluctuating in ways that are difficult to explain to a VVB or to a buyer holding a forward contract. Predictable deductions are financeable. Volatile ones are not.
Our ARR toolbox is modular, so developers and investors engage with the parts they need. In practice most projects move through it in sequence.
Our methodological eligibility assessment compares an area of interest against the applicability criteria of the leading ARR methodologies, VM0047 among them, and returns pass and fail maps for each individual criterion rather than a single verdict. Turnaround is one day. Because eligibility and donor pool construction draw on overlapping data, this stage also surfaces where a project could credibly expand, which is often the question an investor is actually asking.
For stakeholders still choosing between locations, our ARR suitability ranking rates an area from A to E on topography, historical land cover, existing carbon stocks, distance to roads and degradation, fire risk, and any additional client-defined parameters.
Carbon crediting projections combine growth modelling with a simulation of the dynamic baseline to estimate credit volumes and revenue under a given methodology. Growth projections use two complementary approaches: a Local Maximum Approach that identifies mature analogue ecosystems within the same ecoregion on elevation, slope, orientation, temperature, precipitation, climate, vegetation and soil type, and a Forest Carbon Model. This is the analysis that supports investment committee decisions and early offtake conversations.
This is the core of our VM0047 work: the dynamic baseline, the performance benchmark and the associated ex-ante estimates, delivered PDD-ready in three to four weeks.
We design the donor pool area, then process aboveground biomass across the full project and donor pool extent for at least eight years prior to the project start date. Project and donor areas are divided into non-overlapping units of at least 0.01 hectares, and we select 30 or more representative project plots through stratified sampling. Control plots are matched using k-nearest optimal matching, with a minimum of five control plots per project plot across at least five time points, and match quality is evaluated on the standardised difference of means until the pairing holds. Additional matching covariates such as slope or distance to roads can be added where a project's context calls for it.
Matching runs on our 30 metre product, which reaches back to 2013 and therefore covers the historical window the methodology requires. Ongoing monitoring of the stocking index uses our 10 metre product, available from 2017, which improves accuracy on smaller project areas and on heterogeneous plots. We then derive the slopes through weighted linear regression, calculate the significance of the difference between project and control variation, and derive the performance benchmark itself.
Deliverables are specific and auditable: GeoJSON of project and control plots, CSVs of coordinates, plot IDs and stocking index time series, rasters of the index across the historical period, the slope and significance tables, and the performance benchmark with its full calculation steps. Ex-ante estimates cover the entire crediting period, as v1.1 requires, and we can produce the underlying growth projections where a developer has not already done so.
Where developers want complete coverage, we take on the whole of Sections 8 and 9, the quantification and monitoring sections of the methodology. That includes project emissions from biomass burning and nitrogen fertiliser application, leakage assessment under VMD0054 across activity displacement, market and ecological pathways, net removals calculated with uncertainty at the 90% confidence level as the methodology specifies, and the monitoring plan including the database structure for project and control plots.
We measure the indicators needed to assess annual project performance, and we support developers directly in their interactions with VVBs, including written question and answer cycles and technical meetings. Everything we generate during a project stays in our data infrastructure, so when a project reaches verification the evidence base is already assembled rather than reconstructed.
For projects pursuing the ABACUS label, we deliver annual stocking index measurements from at least t=-8 through t=0, which exceeds the label's minimum requirement, and can flag annual biomass loss above the 5% threshold Verra uses to define a loss event.
There are three broad options for the data layer underneath a VM0047 baseline: build it in-house from public imagery, buy a generic biomass product and run the analysis yourself, or work with a specialist. Here is where we think we win.
Our biomass model has been validated against more than one million hectares of independent LiDAR-derived reference maps drawn from six peer-reviewed publications and 113 sites across temperate, tropical and mangrove ecosystems. At site level, the scale relevant to a carbon project, it achieves a mean absolute error of 32.8 tonnes of dry matter per hectare, a relative error of 21%, with an R² of 0.65. Every reference dataset is independent, which is the kind of benchmarking VVBs and standards actually accept. On top of that, we have been assessed by three separate registries: vetted by Verra as a data service provider for VM0047 in May 2026, selected by Isometric as an Earth observation data provider in February 2026, and recognised as a top performer in the Equitable Earth benchmark. Very few providers have been examined that many times by that many independent parties.
As a vetted DSP, our outputs feed directly into the Verra Project Hub, which removes a formatting and reconciliation step from submission and review. Verra is explicit that vetting does not pre-approve any individual project, and we are equally explicit about that with clients, but starting from a data product Verra has already examined against the methodology's requirements changes the character of the conversation with a VVB.
VM0047 deducts creditable removals where sampling uncertainty exceeds the precision tolerance, which makes uncertainty a commercial variable rather than a reporting obligation. We treat it as something to reduce. Every prediction carries pixel-level confidence intervals, estimated through heteroscedastic regression and test time augmentation with spatial correlation accounted for at polygon level. Where field measurements exist, we recalibrate using Gaussian Process Regression, which learns correction patterns from both geographic proximity and spectral similarity, so plots that are spectrally similar benefit from the correction even when they are far away. Lower uncertainty means smaller deductions and, frequently, fewer field plots required in the first place.
A performance benchmark on its own is not a registrable project. We cover the sequence from eligibility screening through to annual monitoring, we write the sections in the form the PDD template expects, and we sit in the VVB meetings. Because we have done this more than 30 times, the questions a verifier raises are usually questions we have answered before.
The same biomass product underpins our work across the ARR landscape, so a developer is not rebuilding their data foundation each time a standard changes. We run the full Track 1 spatially explicit matched dynamic baseline pipeline for Gold Standard's STARR methodology, currently in draft following the public consultation that closed in May 2026, including donor pool generation, pixel-level Mahalanobis matching on the nine mandatory covariates, statistical validation on covariate balance and parallel trends, and a locked reference area with immutability checksums. We assess eligibility against Isometric's Reforestation Protocol, Equitable Earth's terrestrial restoration methodology, Gold Standard, BioCarbon Standard and the ABACUS label. For projects weighing which methodology fits best, that comparison is available before anyone commits.
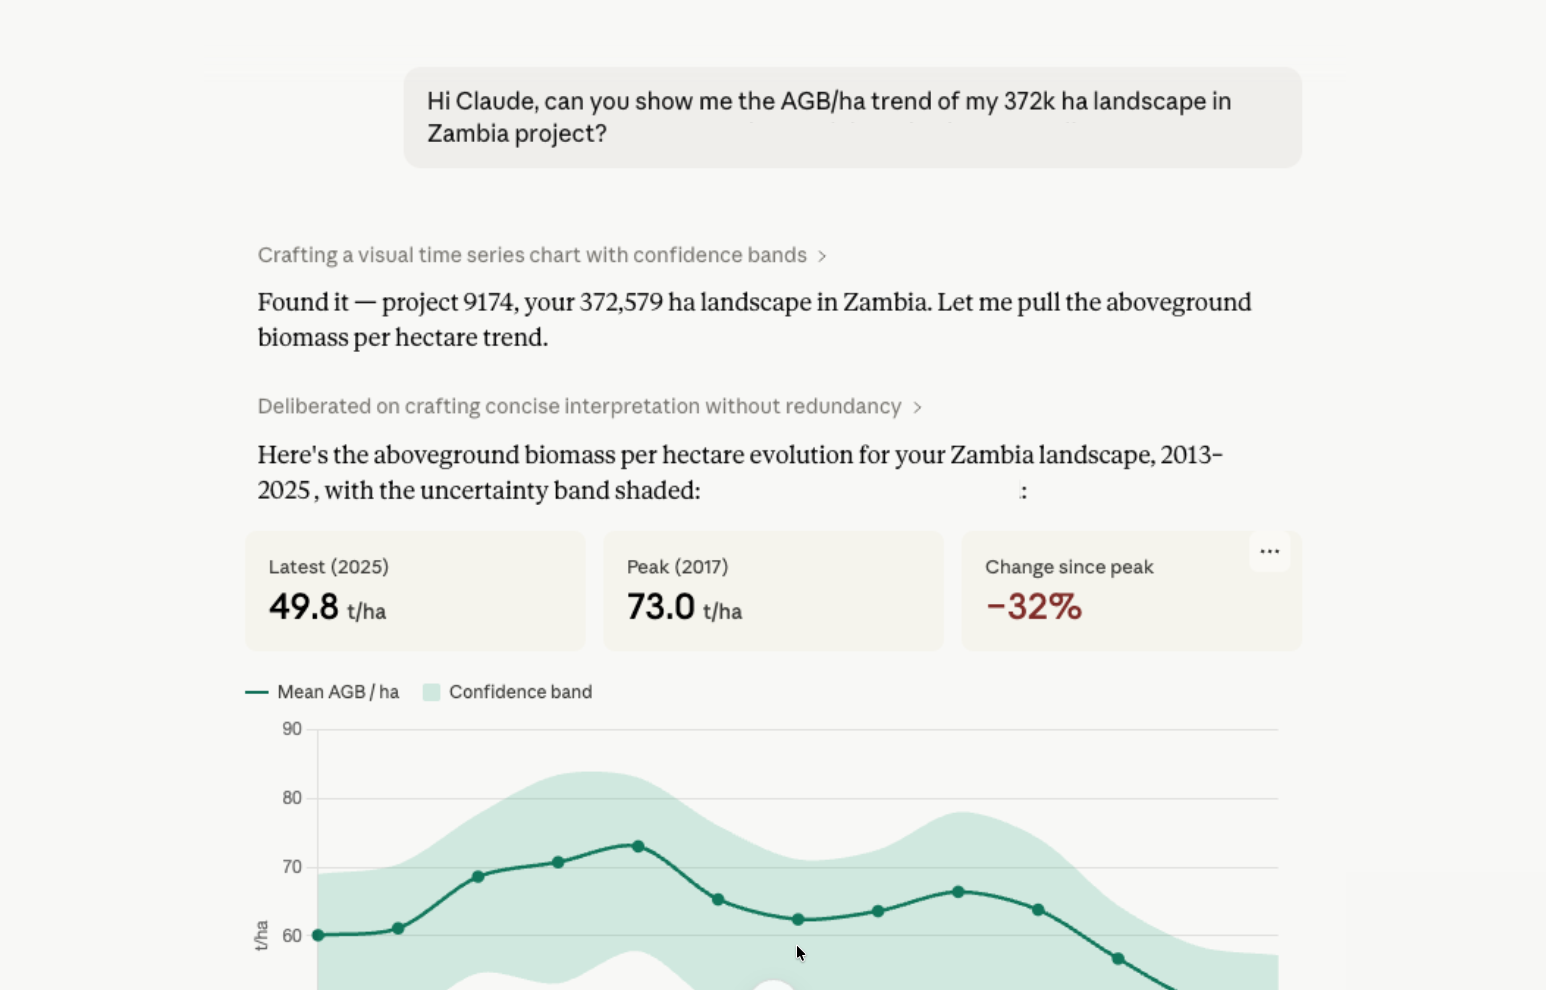
What we deliver, finally, is infrastructure rather than a report. Results are available through our web application and API, and through our MCP server for teams working inside AI assistants. Project data persists, so the next monitoring cycle starts from where the last one finished.
What is a dynamic baseline under VM0047? A counterfactual built from observation rather than projection. Control plots in a surrounding donor pool are matched to project plots on their historical stocking index trajectory, then monitored in parallel with the project. The observed difference sets the performance benchmark deduction.
What is a stocking index, and which one should a project use? A remote sensing metric used to compare project and control plots. VM0047 requires it to correlate with carbon stocks, be derived solely from remote sensing, and remain consistent over time. Vegetation indices are permitted, but they saturate at canopy closure and carry atmospheric and seasonal noise. We use aboveground biomass because it maps directly to carbon stock and behaves predictably over a full crediting period.
How long does the dynamic baseline work take? Three to four weeks from receipt of the project shapefile and the relevant boundary layers, for the baseline, performance benchmark, ex-ante estimates and monitoring plan. Note that the slope and performance benchmark steps require at least one year of post-start project data, since they depend on time series analysis of project activities.
Can VM0007 ARR projects still transition to VM0047? The ARR modules under VM0007 have been retired. Projects listed under VM0047 v1.0 need to complete registration by 31 December 2026. We have run transition analyses that quantify the issuance impact of a methodology switch, which is the analysis a developer needs before making that decision.
Does VM0047 still require field measurements? Yes. Remote sensing carries the baseline, the performance benchmark and the monitoring of the stocking index. Issuance still rests on field measurement, extrapolated across the project area. The two are complementary, and field data also allows us to recalibrate our biomass layer for a specific site.
What about group projects with mixed activity types? Projects combining, for example, natural regeneration and plantation should generally be stratified, with separate performance benchmarks per activity type or planting cohort. Growth rates, starting biomass and therefore viable matches differ so much between them that pooling tends to degrade match quality and blur the benchmark.
Two things are changing at once. The methodological infrastructure for high integrity ARR is settling, with VM0047 now proven through to issuance, CCP approval in place for both versions, and comparable dynamic baseline approaches arriving at Gold Standard, Isometric and Equitable Earth. And the money is moving earlier in the project lifecycle, which means design quality is being priced.
Our next milestone follows directly from that. We are working towards audit-grade carbon projections, starting with ARR, so that the forecast a developer takes to an offtaker carries the same evidentiary weight as the baseline underneath it.
If you are developing, financing or evaluating an ARR project under VM0047 and want to talk through your baseline, your stocking index choice, or a methodology transition, reach out at hello@kanop.io. We are happy to look at a boundary and tell you what we see.