Victor Allory, PhD
Ecosystems & Carbon Engineer

This comprehensive document offers an in-depth, behind-the-scenes look at the intricate processes we employ to generate precise estimates of ecosystem services provided by nature-based solutions. The key components of our methodology are summarized below:
Our data production process begins with the strategic selection of remote sensing imagery. We employ a multi-sensor approach, integrating optical multispectral data from sources such as Sentinel-2 and Landsat-8, as well as Synthetic Aperture Radar (SAR) data from sources like Sentinel-1, PALSAR, and PALSAR-2. To mitigate the impact of atmospheric conditions and ensure data quality, we prioritize imagery acquired during the dry season, identified using IPCC climatic variables and the CRU TS monthly high-resolution gridded multivariate climate dataset (Harris et al., 2020). Advanced pre-processing techniques, including cloud filtering for optical data and specialized SAR Ground Range Detected (GRD) pipelines, are applied to prepare the data for subsequent modeling processes.
At the core of our methodology lies a deep neural network model with global coverage, trained on a vast dataset encompassing 60 million hectares of forests with airborne LiDAR data, including a significant portion from high-resolution airborne LiDAR scans covering 10 million hectares. This multi-output model is designed to concurrently and consistently predict several primary indicators, including tree height, canopy height, canopy cover, and living aboveground biomass.
One of the key features of our model is its ability to jointly predict all indicators, ensuring a higher level of accuracy for each individual indicator. Moreover, each predicted pixel is based on an analysis of over 30 data points, including neighboring areas and local spaceborne LiDAR data from sources like GEDI, resulting in comprehensive and precise predictions. Multi-output CNN models have been shown to improve global performance, reducing the root mean square error (RMSE) by approximately 13% (Mishra and Passos, 2022).
To further enhance accuracy, our Monitoring data product undergoes post-calibration by employing a Gaussian process with user-provided field measurements. This calibration remains effective even when field measurements are from different years or nearby areas of interest, improving the match between our estimates and ground truth data.
From the primary indicators, we derive secondary indicators such as forest cover, living belowground biomass, total biomass, carbon stocks, and their CO2 equivalents. This is achieved by using regional-specific allometric equations and definitions recommended by standards such as the IPCC's "Good practice guidance for land use, land-use change and forestry" (IPCC, 2003). Users can also customize these allometric relationships and definitions via our web application or API to suit their unique project requirements.
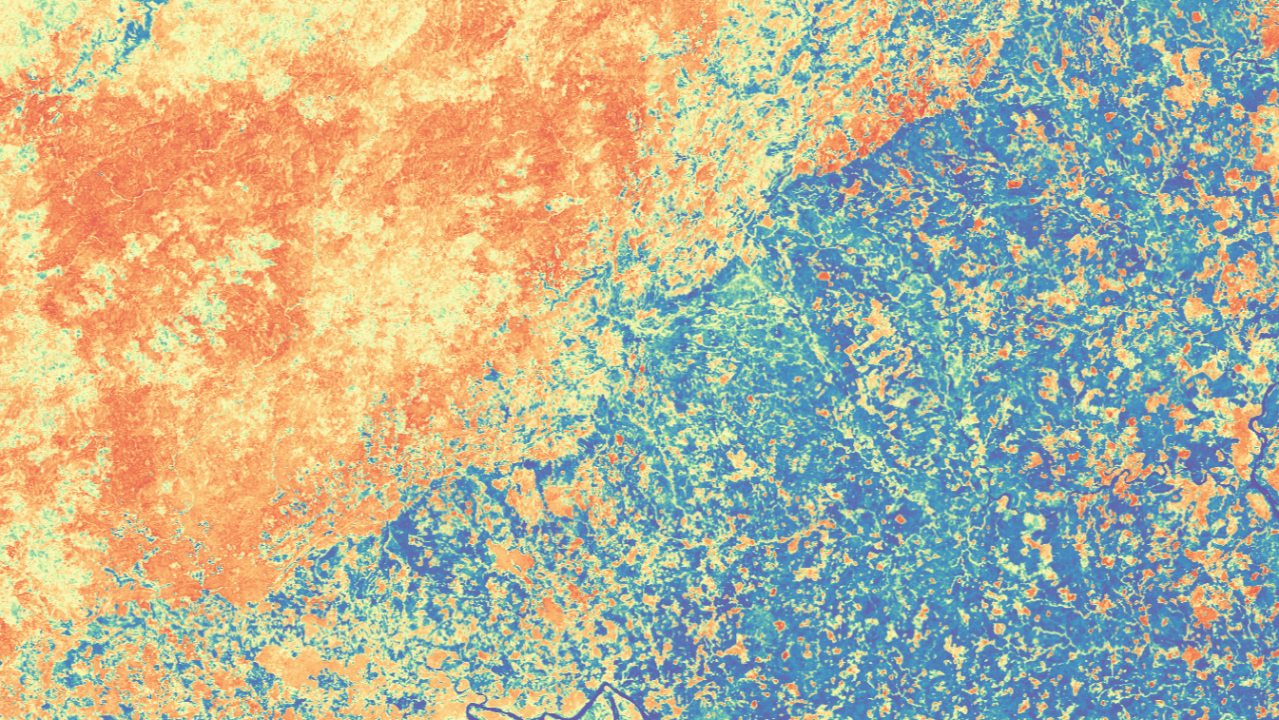
In addition to biomass and carbon estimates, our methodology incorporates biodiversity indicators. Specifically, we calculate Rao's Q diversity index, a spectral variability-based measure of biodiversity, following the approach outlined by Rao (1982) and Rocchini et al. (2017). This index is well-suited for identifying localized areas of high diversity within a project area.
Furthermore, we quantify the uncertainty of our estimates through a rigorous process. We employ Test Time Augmentation (TTA) to estimate the standard deviation at the pixel level, which is then rescaled based on the results of our accuracy assessment. The 95% confidence interval is calculated using this rescaled standard deviation, providing users with a robust measure of uncertainty for each key variable.
To ensure the reliability of our data products, we have conducted comprehensive validation processes, comparing our estimates against independent reference datasets. These include GEDI L2A (tree height), Global Forest Canopy Height (tree height), GEDI L4B (aboveground biomass), and airborne LiDAR- and PALSAR-derived aboveground biomass from three study areas in Brazil (Keller et al., 2019). Our validation results demonstrate high accuracy, with mean absolute errors ranging from 2.9 meters for tree height (compared to GEDI L2A) to 15.9 tons DM/ha for aboveground biomass (compared to GEDI L4B).
Through this robust scientific methodology, Kanop delivers cutting-edge data products that enable informed decision-making and resource management for nature-based projects on a global scale. We are committed to continuous improvement, fostering collaboration, and driving innovation in the field of ecosystem service measurement and monitoring.
KELLER, M.M., DUFFY, P., BARNETT, W., 2019. LiDAR and PALSAR-Derived Forest Aboveground Biomass, Paragominas, Para, Brazil, 2012 23.291921 MB. https://doi.org/10.3334/ORNLDAAC/1648
Mishra, P., Passos, D., 2022. Multi-output 1-dimensional convolutional neural networks for simultaneous prediction of different traits of fruit based on near-infrared spectroscopy. Postharvest Biology and Technology 183, 111741. https://doi.org/10.1016/j.postharvbio.2021.111741
Rao, C.R., 1982. Diversity and dissimilarity coefficients: A unified approach. Theoretical Population Biology 21, 24–43. https://doi.org/10.1016/0040-5809(82)90004-1
Rocchini, D., Marcantonio, M., Ricotta, C., 2017. Measuring Rao’s Q diversity index from remote sensing: An open source solution. Ecological Indicators 72, 234–238. https://doi.org/10.1016/j.ecolind.2016.07.039

